

The Coherence Record, Edition 3
Fifteen entities. Five sectors. What the fleet revealed.

Edition 1 asked whether this infrastructure could exist. Edition 2 asked whether it could measure one company. This edition asks whether it holds at scale.
Justin R. Greenbaum
Greenbaum Labs
February 2026
What’s Happened
Edition 2 ended with a promise: the system needed to prove it measured coherence, not just one company.
This edition is that test. And what happened when the test exposed a flaw in the system itself.
Between February 10 and February 25, the pipeline ran sixty-four diagnostics across fifteen entities and five sectors: fintech, defense, automotive, retail, technology, aerospace, sports betting, and apparel. The final fleet of fifteen completed clean. Every pipeline stage passed. Every validation check cleared. No manual intervention on synthesis.
But that clean fleet was the second attempt. The first attempt revealed something the pipeline wasn’t designed to catch. The way it was found, fixed, and re-run is as much a part of the record as the results.
From the start, The Coherence Record has been as much about instrument failure as subject failure. Edition 1 documented a misplaced parameter. Edition 2 documented premature optimization. Edition 3 adds a third class of error: a system that passes every check and is still wrong.
The Bug
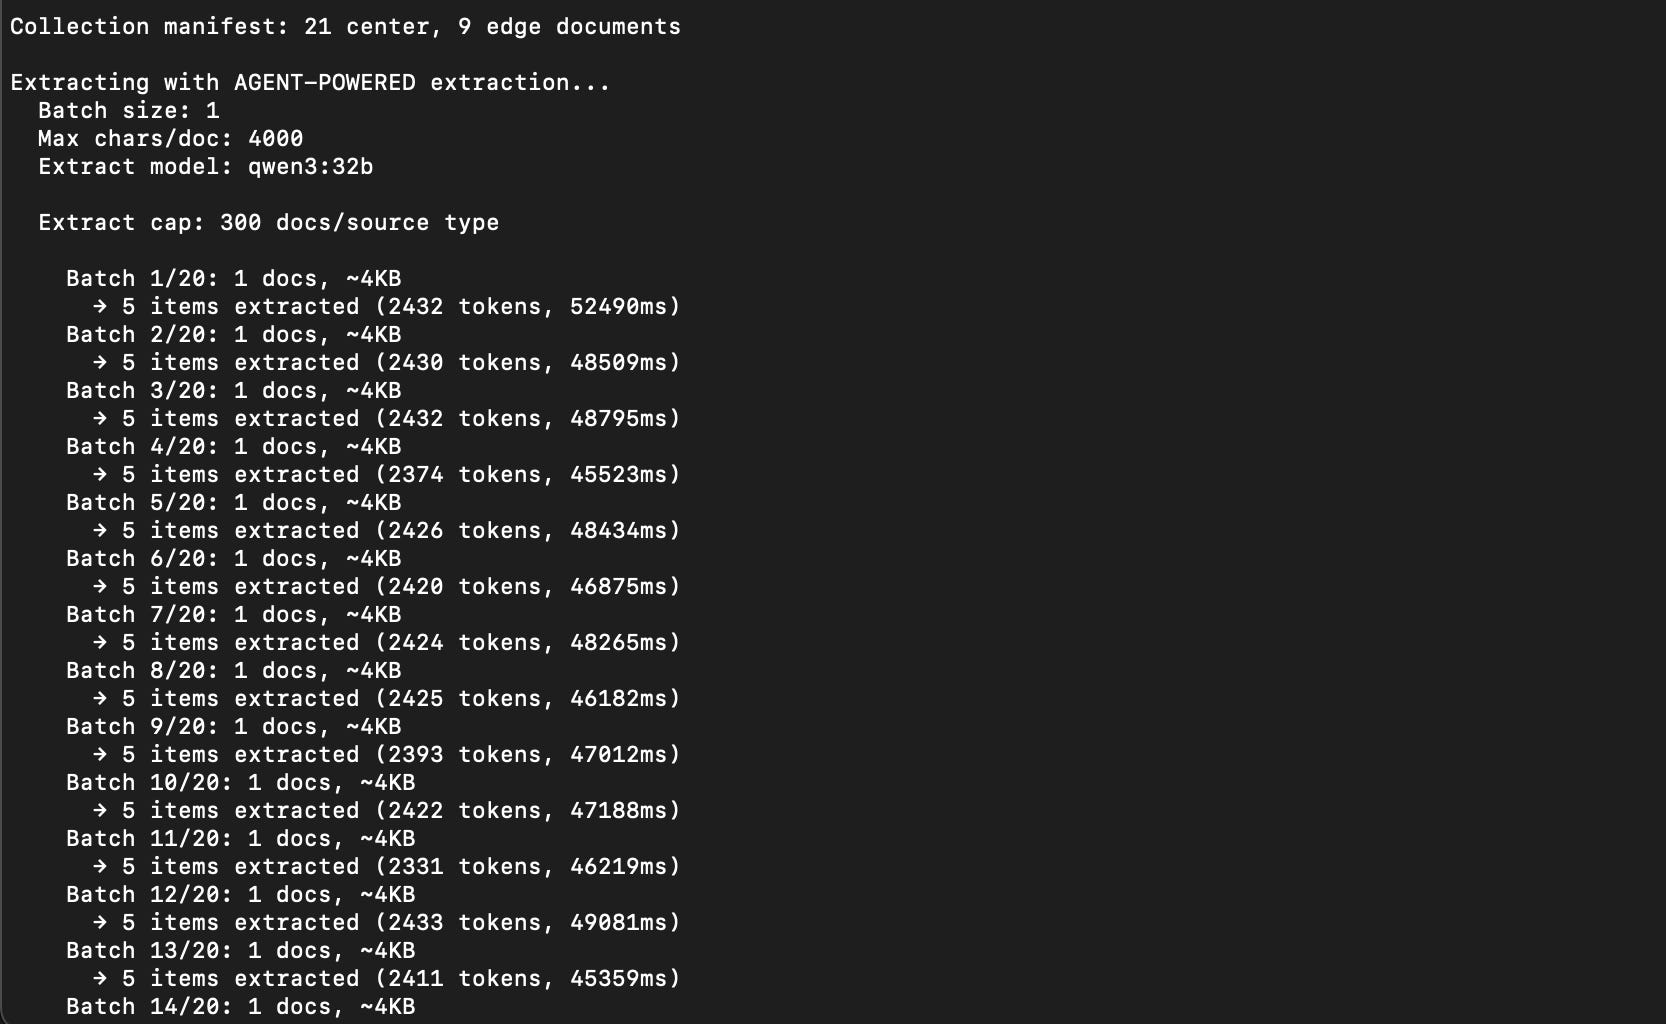
After the first seven entities completed (the batch documented in the draft that preceded this edition), I expanded the fleet to fifteen. Fourteen ran. The fifteenth failed at scoring with an empty evidence ledger. When I investigated, the problem wasn’t in the scoring. It was in the extraction.
A JSONL expansion bug in the extractor had been silently duplicating and malforming observation records. The extractor reported healthy counts. The validator accepted the files. But the data feeding the scorer was structurally compromised. Inflated observation counts masking thin actual evidence. Fourteen of fifteen entities were affected.
The discovery happened because one entity’s data was thin enough that the corruption left the scorer with nothing to work with. In the other fourteen, there was enough valid data mixed in with the corrupted records that the pipeline produced plausible-looking outputs. Plausible, but not trustworthy.
Every diagnostic from the affected runs was discarded. The bug was fixed. All fifteen entities were re-run from extraction forward. The fleet you see in this edition is the clean re-run.
I’m documenting this for the same reason I documented the misplaced parameter in Edition 1 and the premature optimization in Edition 2. Edition 1 was about incorrect configuration. Edition 2 was about incorrect prioritization. Edition 3 is about incorrect trust in “passing” checks. A system that measures the gap between narrative and reality must disclose its own gaps.
The lesson is not about JSONL parsing. It is about the distance between validation and verification. Every validation check passed. The data was structurally valid. It was not structurally sound. Those are different things, and the pipeline didn’t know the difference until it was forced to.
Organizations make the same mistake. They validate that reports are complete. They rarely verify that those reports describe what is actually happening.
The system’s first real success in this fleet was proving it could be wrong.
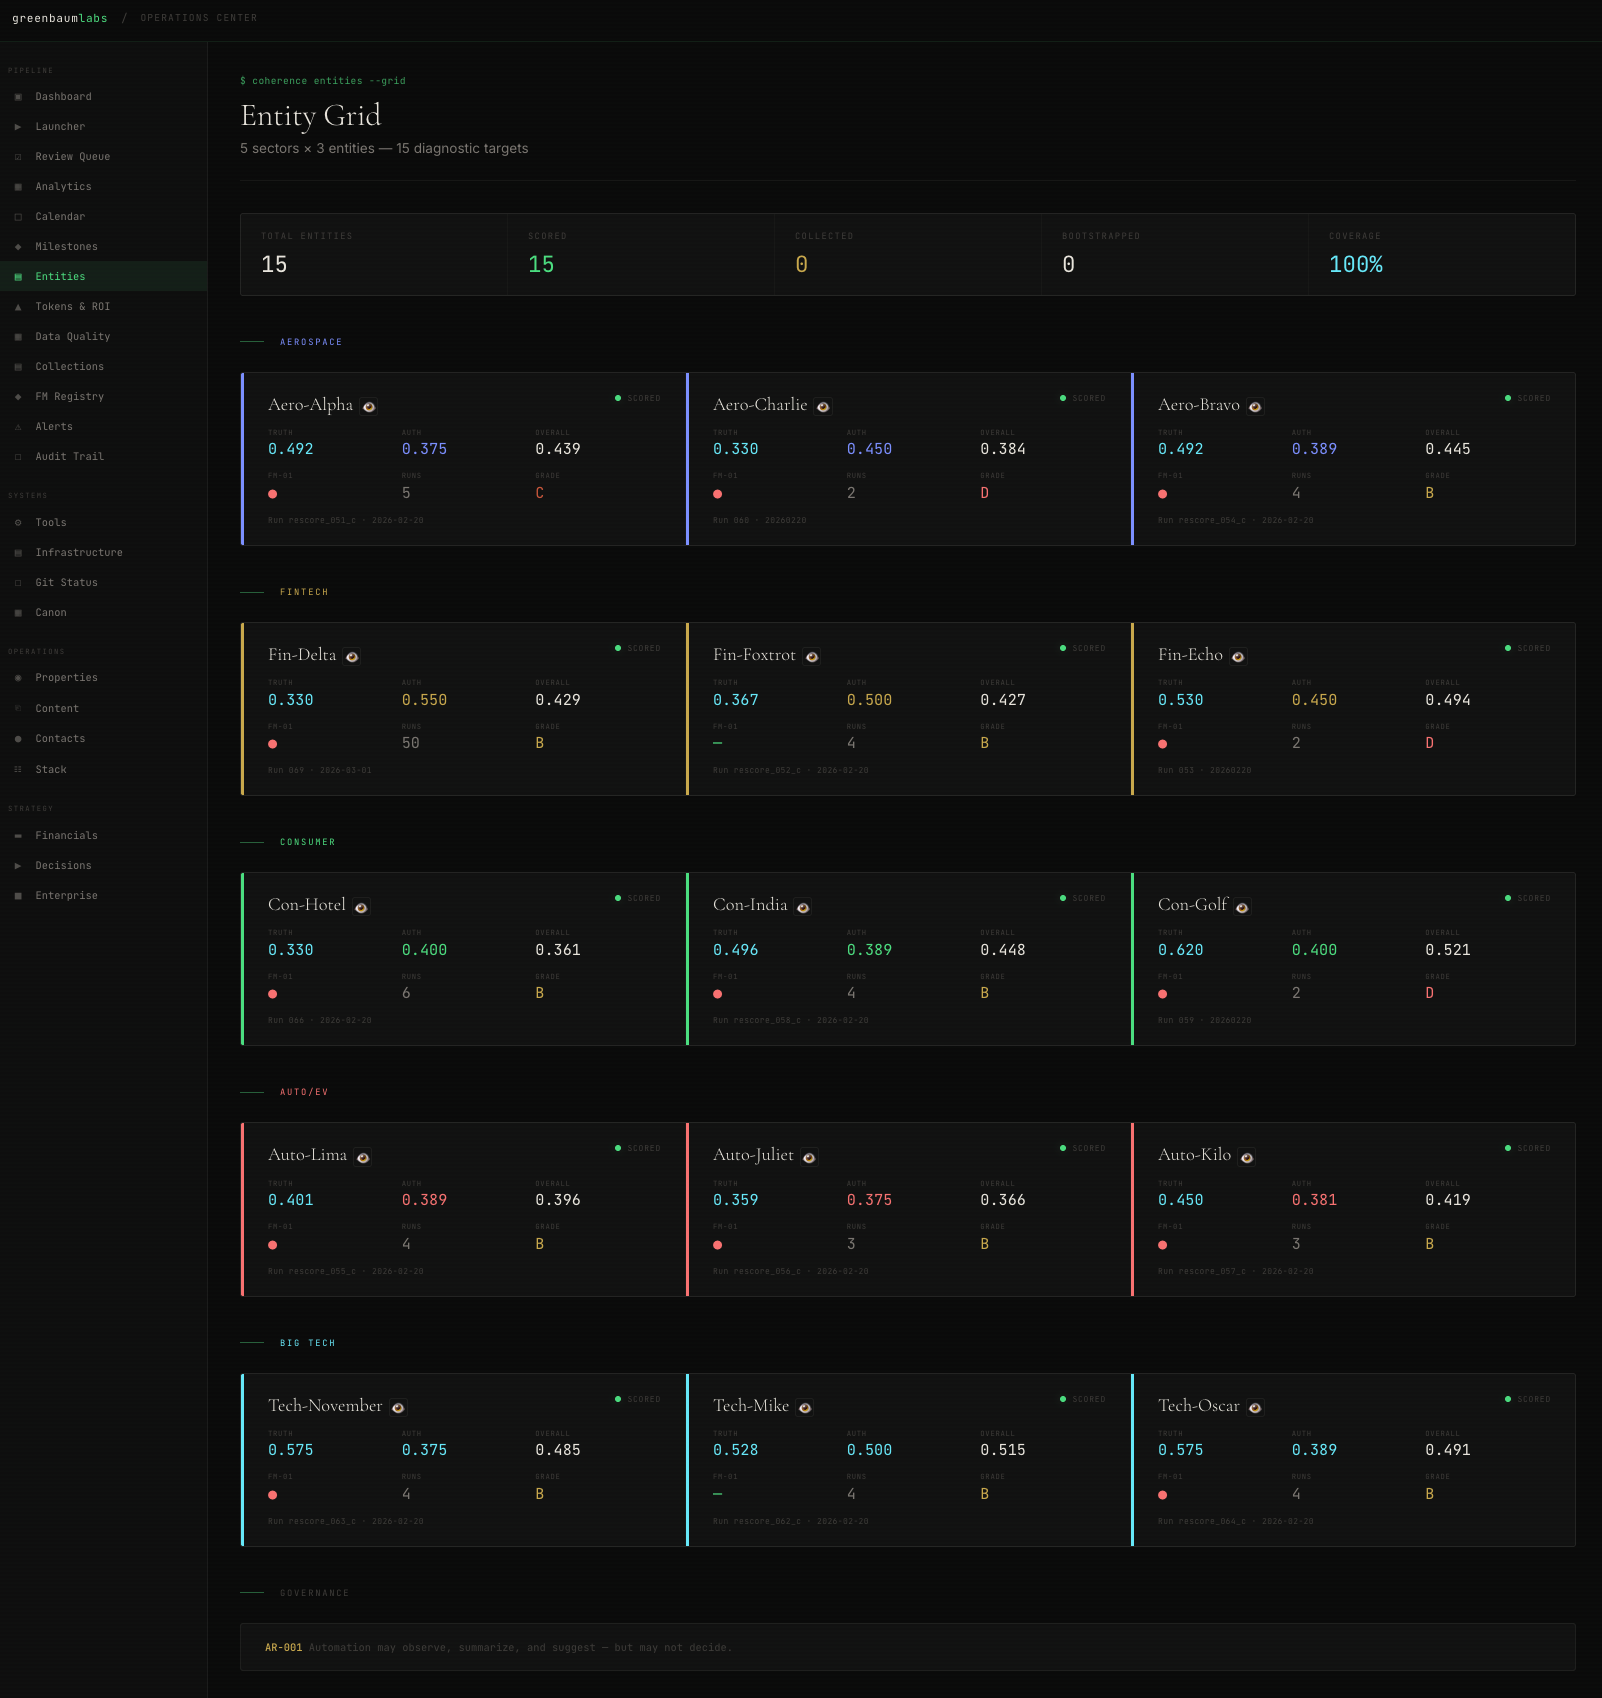
The Fleet
Fifteen entities. Five sectors: fintech, defense, automotive, retail, and technology, with single representations in sports betting, aerospace, and apparel. Same pipeline version (0.1.0). Same model (Qwen 32B). Same collection date (February 20, 2026). Two NVIDIA DGX Spark nodes running in parallel, orchestrated by an automated queue runner that distributed work across both machines.
Fleet average coherence score: 0.458. Scores ranged from 0.36 to 0.54. Total inference time: approximately 35 hours across both nodes. Forty-one million tokens processed over sixty-four total runs. On commercial cloud APIs, that volume would have cost roughly $586. On owned hardware, the marginal cost was electricity.
Data quality grades ranged from B to D. The entities with the thinnest data produced the fewest sustained findings. Expected behavior, but it means the cleanest-looking diagnostics may also be the least examined. Evidence density and diagnostic confidence are not the same thing, and the fleet made that visible.
Every run produced a complete diagnostic with triangle scores, failure modes, field notes, and a watch list. The pipeline did what it was designed to do. The problems, and they are real, are in what the diagnostics reveal about both the entities and the system measuring them.
What the Fleet Shows
Truth is the most stressed vertex in ten of fifteen entities. The pattern from Edition 2 holds at scale: organizations say things publicly that don’t match what’s observed at the operational edges. Product claims contradicted by customer complaints. Culture narratives contradicted by employee experience signals. Financial performance framing contradicted by external analysis.
In Edition 2, that misalignment could have been a property of one company. In a cross-sector fleet, it reads as physics, not pathology.
Five entities showed Authority as their most stressed vertex instead. These cluster in interesting ways. A global retailer scored the highest Truth in the fleet. It says what it means, but its authority structure was the least clear. Two automotive companies both stressed on Authority rather than Truth, suggesting that in fast-moving industries, the primary fracture isn’t narrative integrity but decision-making distribution.
Why Cross-Sector
This question matters enough to answer directly.
The Coherence framework emerged from twenty years inside one organization, one industry, one set of structural pressures. It would be reasonable to wonder whether the patterns are just artifacts of that context. Responsibility compression might be a telecom problem. Escalation inversion might be a regulated-industry problem. The entire failure mode taxonomy might describe one company’s dysfunction dressed up as universal physics.
Edition 2 made that risk visible: a single-company diagnostic could always be dismissed as idiosyncratic.
The fleet was designed to answer that question.
Fifteen entities across five sectors. Public companies and private ones. Pre-crisis, mid-crisis, and post-crisis organizations. Legacy incumbents and startups. Companies with two thousand employees and companies with two hundred thousand. The only things they share are scale and public signal.
If the patterns only appeared in one sector, the framework would be local. If they only appeared in crisis organizations, the framework would be reactive. What the fleet showed is that FM-01 appears in fourteen of fifteen entities. That truth stress is more common than authority stress. That the same structural forces that produce dysfunction in aerospace also produce it in retail, fintech, automotive, and technology.
Edition 1 proved the infrastructure could run on owned hardware against public data. The fleet proves the language it produces has signal beyond the company that trained my intuition.
Not for coverage. For falsification.
Failure Modes
FM-01, Responsibility Compression at the Edge, appeared in fourteen of fifteen entities. It is the most persistent structural signal in the fleet.
In Edition 1 and 2, FM-01 read like a problem to be fixed. At fleet scale, it behaves more like gravity: sometimes benign, sometimes lethal, always present.
This is not a defect to be eliminated. It is a structural force. Always present, always acting. The physics of business at scale and speed. The question is not whether FM-01 exists but what it means at different intensities.
A resting heart rate of 72 and a resting heart rate of 120 are both a heartbeat. One is baseline. One is a signal that something is producing strain. The same is true of responsibility compression. Elevated FM-01 is not a diagnosis. It is a vital sign.
FM-04 (Metric Shadowing) and FM-14 (Narrative Collapse) co-occurred in six entities. Where organizations optimize visible metrics while unmeasured costs accumulate, the public narrative eventually decouples from operational reality. The co-occurrence suggests a causal relationship the taxonomy doesn’t yet model.
The average entity triggered three to four distinct failure modes. The most structurally stressed triggered six. The cleanest each triggered one. But cleanliness correlates with evidence density: the entities with fewer failure modes also had fewer sustained findings. The system may be under-detecting rather than finding genuine structural health.
Field Notes
The most signal-dense entity produced thirteen distinct field notes, nearly the full set. Two others triggered eleven each. The leanest produced five. Field note density correlates loosely with evidence density and data quality grade, which means the pipeline produces more diagnostic signal when it has more to work with. That is the expected behavior, but it also means thin-data entities may be under-diagnosed rather than structurally healthy.
What the Pipeline Shows
Edition 1 proved the instrument could produce signal. Edition 2 proved it could debate itself. The fleet shows where that debate logic and its surrounding infrastructure still fail.
Truth scores cluster at the floor. Five entities landed at exactly 0.33 on Truth, spanning fintech, defense, automotive, aerospace, and technology. These are structurally diverse organizations. Either center-edge narrative misalignment really is that uniform across industries, or the scoring model compresses within the low range and can’t differentiate between moderately misaligned and severely misaligned. At five entities, the clustering is too consistent to ignore. The scorer needs a wider aperture in the lower range.
The Skeptic works. Including when it shouldn’t. One entity’s initial run failed because the Skeptic rejected all six findings in the debate round. Every rejection followed the same pattern: insufficient specificity, lack of quantification, reasoning not grounded in evidence. The Skeptic also had a schema validation failure on its first attempt, which forced a retry. The retry was in an overly-critical mode. A re-run of the scoring step produced a healthy result: three sustained, four rejected. The debate mechanism is calibrated to evidence strength, but it’s not robust to its own retry state. That’s a design flaw.
Output confidence must be constrained by evidence density. The fleet’s lowest-scoring entity’s diagnostic reads like a complete assessment. It is not. One sustained finding. One ledger entry. The weakest data quality grade in the fleet. The synthesizer doesn’t know how thin its support is. It produces full output regardless. A diagnostic built on one piece of evidence needs to say so. Not in a metadata field. In the output itself. The data quality grade flagged the problem. It didn’t constrain the output. That grade needs to be load-bearing.
The fleet automated, but the infrastructure didn’t. Running fifteen entities across two Spark nodes required a queue runner script built the same week. NAS mounts dropped mid-run. One node lost its mount entirely and couldn’t be used for the re-run. The pipeline code is stable. The infrastructure around it (mount management, node health checks, job recovery) is manual. At fifteen entities, that’s manageable. At fifty, it won’t be.
What’s Capped
The structural constraints from Edition 2 remain and are now systematic: Authority capped by lack of internal signal; Continuity dark because the system only sees a single time slice.
Authority is capped because the pipeline has no employee reviews in edge data. This was a single-entity problem in Edition 2. It now affects all fifteen entities. Customer complaints and news coverage show the outside. Employees see the inside. Without that signal, the Authority scorer can’t fully assess whether internal power structures match internal accountability. This is where client-invited work changes the equation. With internal access, the Authority vertex uncaps.
Continuity remains unscoreable across all entities. Every run is based on a single collection period. One-third of the Triangle is dark. Edition 2 accepted that darkness as a constraint. Edition 3 turns it into a design requirement.
What I Learned
Validation is not verification. Every check passed. The data was still corrupted. The difference between “the file is well-formed” and “the file contains trustworthy data” was a gap I didn’t build for. Now I have to.
Scale doesn’t just test the pipeline. It tests the framework. Scale didn’t just stress the GPUs. It stressed the assumptions baked into Edition 1 and 2. Edition 1 asked whether the pipeline could exist on owned hardware. Edition 2 asked whether it could measure coherence inside one company. The fleet changed the question again: are these failure modes properties of that context, or properties of large organizations as such? Fourteen of fifteen entities showing FM-01 is a different kind of answer than one entity showing it across thirteen runs.
Failure modes are vital signs, not verdicts. FM-01 at every entity doesn’t mean every entity is failing. It means responsibility compression is structural to organizations at scale. The diagnostic value isn’t detecting it. It’s measuring intensity. The pipeline doesn’t do that well enough yet.
Evidence density caps diagnostic confidence. A thin-data entity producing a clean diagnostic is not the same as a rich-data entity producing a clean diagnostic. The pipeline treats them the same. It shouldn’t.
AR-001 Still Holds
Automation may observe, summarize, and suggest, but may not decide.
AR-001 constrained Edition 1’s experiments and Edition 2’s single-company diagnostics. It constrains the fleet just as hard.
Every diagnostic in this fleet is a suggestion. Every finding requires human review. Fifteen entities didn’t change that. Fifty won’t.
The pipeline knows more than it did in Edition 1. It covers more ground than it did in Edition 2. It is not closer to deciding. That’s by design.
What’s Next
Light Continuity. A second collection period for a subset of the fleet will produce the first Continuity scores. The third vertex of the Triangle will light for the first time. Even a four-week gap between collections should show whether narratives hold, shift, or contradict prior positions.
Scorer calibration. The Truth floor at 0.33 needs investigation. Either it’s real and that’s the baseline for large organizations, or the scoring model compresses signal in the low range. A targeted scoring test with expanded rubrics should clarify.
Data quality as output constraint. The data quality grade needs to constrain what the synthesizer produces. A Grade D diagnostic should look visibly different from a Grade B diagnostic. Not just in metadata. In the output itself.
Infrastructure hardening. NAS mounts, node health, and job recovery need to be automated. The pipeline code is stable. The infrastructure running it is not.
A system that improves visibly, in public, with its failures documented alongside its progress. That’s the goal.
What This Is Becoming
Edition 1 proved the infrastructure could exist. Edition 2 proved it could measure. Edition 3 proves the measurements change how the framework itself is understood. FM-01, the failure mode that carries the most direct weight on humans, is no longer treated as a defect to eliminate but as a structural force to measure.
And where FM-01 goes, the other structural forces follow: authority diffuses, context decays, metrics drift from the reality they were built to measure. Some of those are persistent conditions. Some are acute. The diagnostic work is learning to tell the difference.
AI accelerates this physics. It doesn’t change the forces. It increases the speed at which they produce consequences. An organization with elevated responsibility compression and good human buffers can sustain that for years. The people closest to the work absorb the strain, compensate through judgment and relationships, and keep the system functioning. Add automation that removes those buffers or increases throughput without addressing the underlying compression, and the same physics produces symptoms in months instead of decades.
That is what coherence measurement is for. Not to judge organizations. Not to score them against each other. To make the structural forces visible before they become symptomatic. To give organizations a way to slow down just enough to see what’s actually happening inside their processes before they deploy automation on top of conditions they can’t see.
The physics of business at scale and speed, accelerated by AI. Sixty-four runs in, the instruments are getting sharper. That’s what this work measures.
Justin Greenbaum
Greenbaum Labs
February 2026